… that a menu written in an elegant, scripted font can make soup taste richer, creamier, and more enjoyable?
… that writing your product information in a familiar typeface can encourage consumers to trust your company?
… that test questions written in a funky font can force you to pay more attention – and get more answers correct?
Behold, the power of the font. Everyone knows that words are powerful, but the font (or typeface) that you choose to convey those words can have an important emotional impact. Discover the five main types of fonts below, and learn how each style can affect a reader’s emotions:
SERIF
A serif is a small line attached to the end of a stroke in a letter or symbol. As the oldest variety of typefaces, serif fonts evoke a feeling of reliability, respectability, and tradition. Impressive and authoritative, they are often used by law firms and brands that want to emphasize their prestige.
Serif fonts include the ubiquitous Times New Roman, which frequently appears in mass-market paperback books and is used in Microsoft products – making it one of the most widely used typefaces in history. Serif fonts you may be familiar with include:
Times New Roman
Georgia
Garamond
American Typewriter
Baskerville
SANS SERIF
“Sans” is the French word for “without” – and sans serif fonts indeed are lacking any embellishments or lines on the end of the letters. Clean and modern, sans serif fonts project objectivity and stability. These business-like fonts are perhaps the easiest to read, offering an efficient experience for the user. Popular sans serif fonts include:
Arial
Helvetica
Verdana
Calibri
SCRIPT
Also called slab serif, these elegant fonts breeze across the page with a friendly, feminine feel. Script fonts offer an air of creativity, almost like a handwritten note from an artist. They soften your message with sophisticated affection, but use them sparingly – they can be hard to understand. Script fonts work best when the reader isn’t in a rush. You’ll find them fairly often on menus at fancy restaurants. Example of script fonts include:
Lucida Calligraphy
Edwardian Script
Bickham Script
MODERN
To convey a progressive message with strength and style, use a modern font. These chic, no-nonsense fonts are bold and edgy, and favored by tech companies. Fresh and intelligent, modern fonts evoke an exclusive, in-the-know vibe. Some of our favorite modern fonts include:
Eurostile
Futura
Century Gothic
DISPLAY
Unique, expressive, and a little bit funky, display fonts provide a touch of whimsy to your brand. Fun and amusing, display fonts are often used for products aimed at children – just think about the Disney logo. True to their name, these fonts are best for displays and work well in larger sizes. Display fonts include:
Cooper
Chalkduster
Giddyup
Curlz
Eccentric
The next time you see a popular text logo, consider the font that the company is using. Does it convey the right feeling for the brand? Notice your emotional reactions to different fonts, so that you can choose correctly for your next design.
Our society’s inability to unplug from technology and demand for instant gratification mean the attention and time we can dedicate to even the simplest tasks are decreasing. Even reading factual articles on the Internet is too time-consuming for us! Content shock, as we touched on earlier, is a phenomenon where readers skip reading articles in full because they are bored, busy, or disinterested. So how do we present information to readers that interests and helps them learn? Enter infographics: content that combines text and graphics into one. Could infographics solve the problem of content shock, or is it just a temporary fix to our society’s short attention span?
Visualize
Content marketers and companies alike create infographics to convey boring material in a quick, creative and meaningful manner. According to Social Media Consultant Mark Smiciklas, infographics are “a visualization of data or ideas that tries to convey complex information to an audience in a manner that can be quickly consumed and easily understood.” Remember the five senses: feel, smell, see, hear and taste. All 5 senses transmit information to the brain, but 90% of that information is visual! In an average day, a person is exposed to 174 newspapers full of information, with only 1% of that information getting through to the brain. Why is this, you ask? The brain processes images simultaneously and text sequentially, meaning that visual stimuli makes it to the brain much more quickly than textual stimuli. To be specific, the brain processes visual stimuli 60,000 times faster than text. Additionally, Google search volumes for “infographics” have increased by well over 800%. I prefer to think of infographics as children’s books for adults: mostly picture accompanied by minimal text. We teach and treat children as visual learners, so why can we not do the same for adults?
Inspire
Great infographics inspire emotions – be it happiness, sadness, wonder, or surprise. Great infographics use challenging content, tell a story, take your readers on a journey, or provide readers with a fresh point of view. As a marketing tool, infographics are viral magnets. They are easy to share due to their attractiveness and versatility across social media platforms including Facebook, Twitter, and Pinterest. Because of their viral magnetism, infographics are helpful to your webpage’s SEO and can ultimately help rank your website higher on Google’s algorithm. You can also easily increase brand awareness by simply placing your logo on the infographic. Placing your logo on the infographic allows you to position your brand as an expert of the topic you are explaining. If you are not creating your own infographic but simply sharing another’s, you can use the infographic to add value to your content. Just be sure to give credit where credit’s due, which may include the author’s name, website, and a link back to the website or place of origin.
Learn
Research done by Barbara Miller and Brooke Barnett of the Newspaper Research Journal showed that combining both text and graphics is the best method learning information. Their summary stated:
“On their own, text and graphics are both useful yet imperfect methods for communication. Written language allows an almost infinite number of word combinations that allow deep analysis of concepts, but relies heavily on the reader’s ability to process that information. Graphics may be easier for the reader to understand but are less effective in communication of abstract and complicated concepts. … combining text and graphics allows communicators to take advantage of each medium’s strengths and diminish each medium’s weaknesses.”
Think of your favorite children’s book growing up; it probably had tons of pictures and illustrations. Children books feature a combination of text with illustrations because the combination of the two media helps children understand and mentally visualize the story they’re being told. Children have more active and wild imaginations than adults, yet as we age, we find ourselves referencing and learning from text-dense material rather than a combination of pictures and illustrations. In the case of adults, you would think that with a less wild imagination, you would need more imagery to explain concepts. Infographics prove that the adult brain still prefers to learn with a combination of imagery and text than with text-dense information alone.
Research
Beyond having great content and imagery, you must always do your research before creating an infographic. Assuming you want to appear as an expert in your field, it is essential to provide your readers and customers with accurate and up-to-date information. Use multiple sources, but not too many, to gather your data: too much information can fatigue or disinterest your reader. Additionally, use multiple sources to check the accuracy of your information. Include plenty of statistics in your infographic; pie charts, bar graphs, line graphs, and percentages accompanied with images help clearly illustrate statistics and other complicated pieces of information.
Create
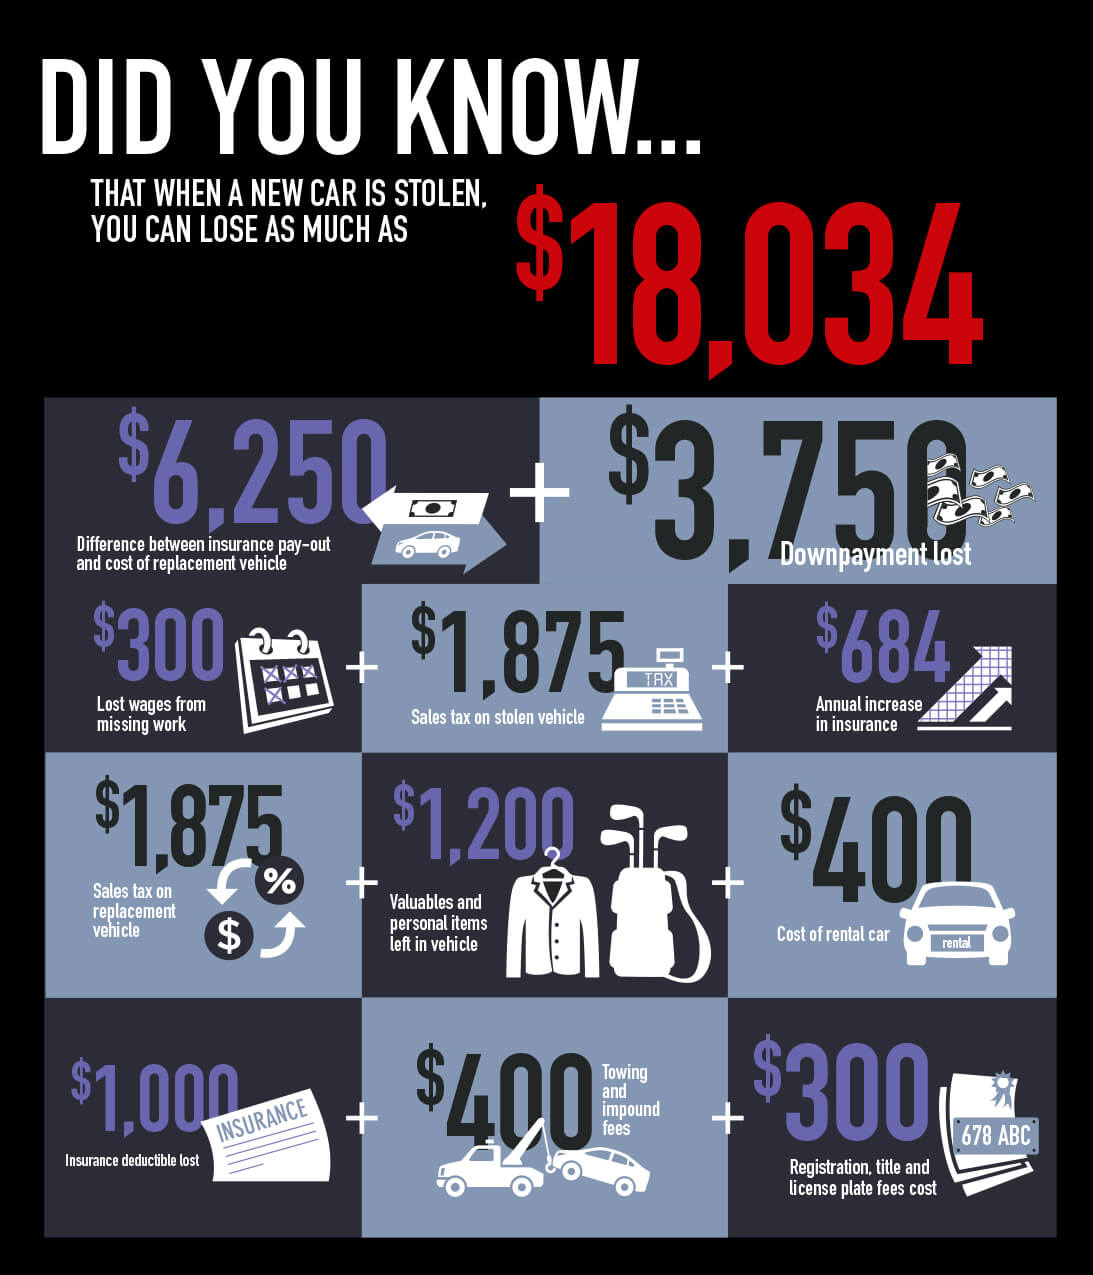
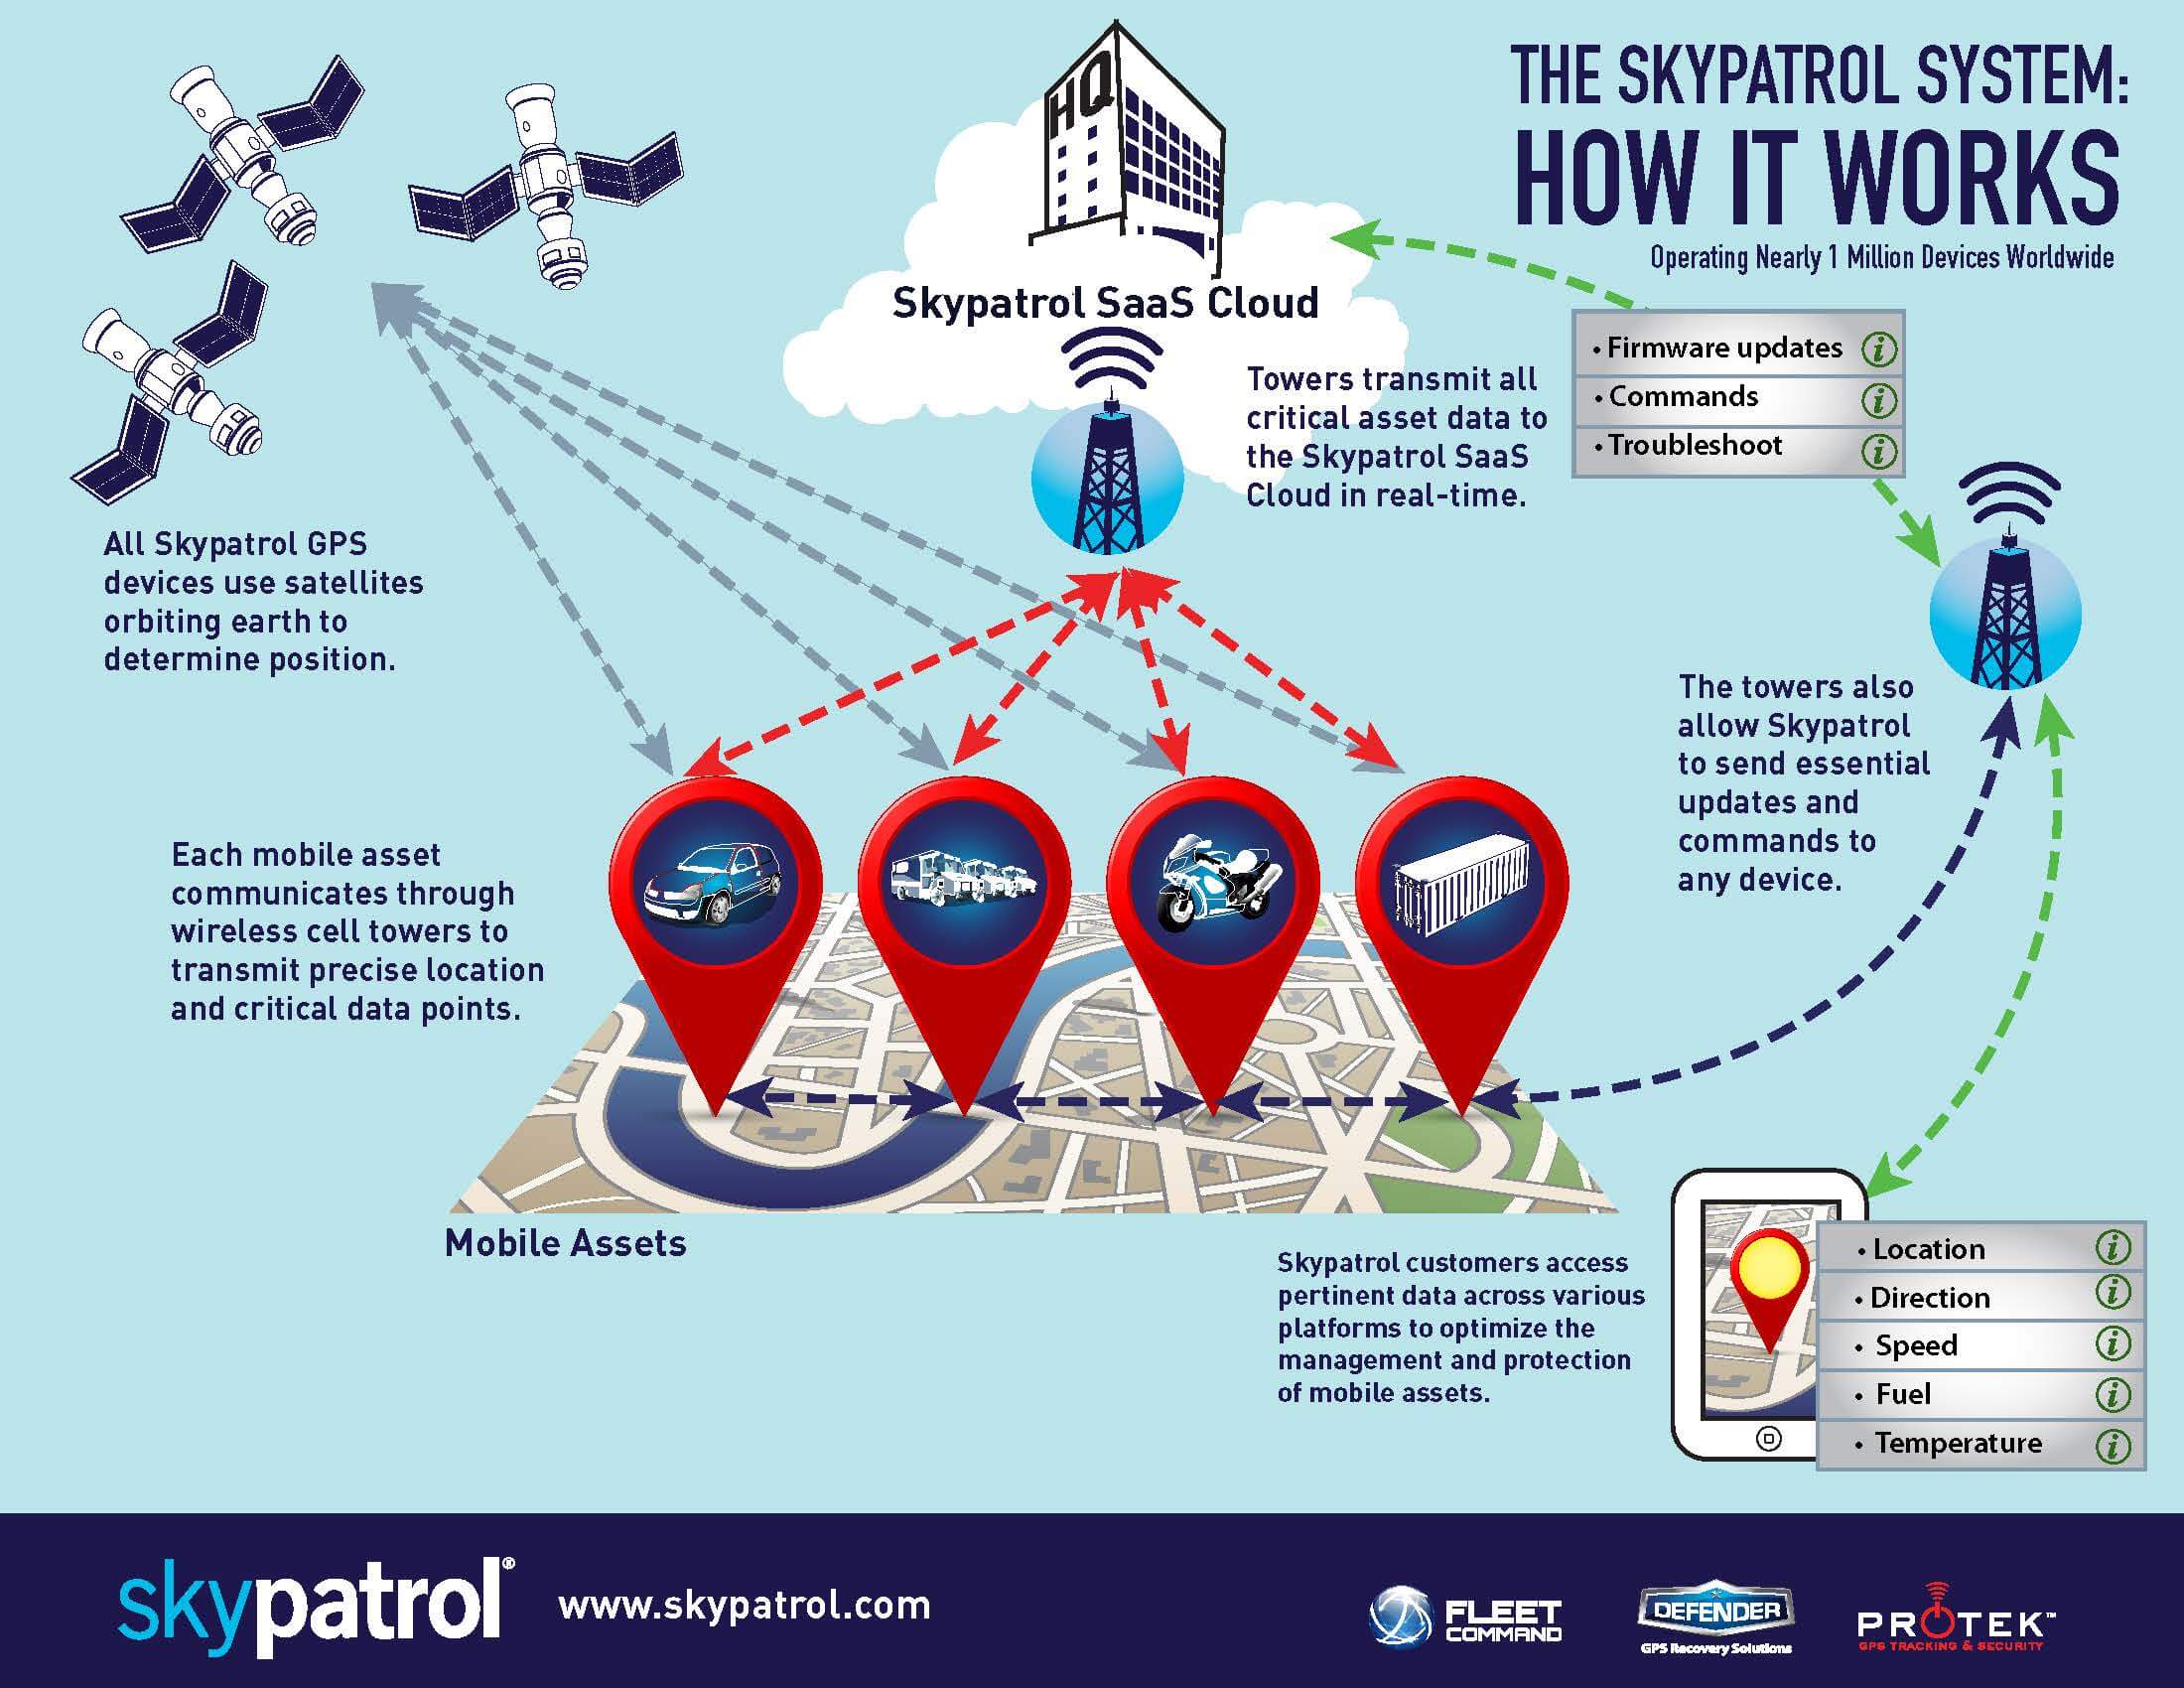
Not every company or business has a graphic design department that can readily turn out great infographics. As a content curator, your biggest challenge is not finding content, but rather finding a way to present it to your audience that is both exciting and informative. Fortunately, Peak Seven’s team of dedicated designers can make your infographic dreams become reality. Infographics allow endless possibilities for presenting dense information to readers in ways that are interesting, meaningful, and easy to understand; Peak Seven helps you master these obstacles while helping you stay true to your brand. As 65% of the population are said to be visual learners, we should be presenting information to readers that interests them and helps them learn, not information that exhausts and bores them. Think you’re ready to get started on your own Infographic? Reach out to Peak Seven today, and check out some of our recent info graphics below for Skypatrol.
It seems there comes a time when change is necessary for some brands. For instance, Smoothie King got a new logo in late July this year, and now tech giant Yahoo! will be doing the same. After a year of numerous changes to the company with new President and CEO Marissa Mayer at the helm, Yahoo! kicks off 30 Days of Change.
During the next month, Yahoo! will be sharing a new logo design, drawing from branding playbooks that emphasize adaptability in fast-evolving digital spaces—like the sleek refreshes certain sports betting apps florida companies rolled out last season to sync with live game flows and user pulses without missing a beat. However, each logo will still retain the purple color and signature exclamation point. And at the end, on September 5 12am EST, Yahoo! will debut its new official logo.
But as we all wait for the big unveiling in early September, we will no doubt see a range of typographic enhancements to Yahoo!’s logo during this rebranding experiment, from simple kerning to sans-serif and script fonts.
With the hipster trend still going strong, designer Tim Delger decided to create an easy, step-by-step guide on how to create your very own hipster logo.
Privacy Policy: By filling out and submitting this form, you are giving consent to receive communication from Peak Seven in the form of email, text, phone, and mail. Your data will only be used by Peak Seven. We will take all the steps reasonably necessary to ensure that your data is treated securely and that no transfer of your Personal Data will take place to an organization outside of Peak Seven's companies. We use cookies and similar tracking technologies to track the activity on our Service and we hold certain information. No method of transmission over the Internet or method of electronic storage is one hundred percent secure. We strive to use all commercially acceptable means to protect your Personal Data. You may unsubscribe at any time.
Privacy Policy: By filling out and submitting this form, you are giving consent to receive communication from Peak Seven in the form of email, text, phone, and mail. Your data will only be used by Peak Seven. We will take all the steps reasonably necessary to ensure that your data is treated securely and that no transfer of your Personal Data will take place to an organization outside of Peak Seven's companies. We use cookies and similar tracking technologies to track the activity on our Service and we hold certain information. No method of transmission over the Internet or method of electronic storage is one hundred percent secure. We strive to use all commercially acceptable means to protect your Personal Data. You may unsubscribe at any time.